Why is Visualizing Traffic Data Helpful for Smart Cities?
What is Video Business Intelligence?
Today, with the growing adoption of the Internet of Things (IoT), digital data is plentiful, with technology can tracking and aggregating so many forms of data for various applications. Increasingly, cities are relying on data intelligence to become “Smart Cities.” That is, they gather data from multiple sources to increase efficiencies, improve residential quality of life, optimize municipal operations and, of course, improve public safety. One important aspect of local security is traffic management, and business intelligence has enabled many smart cities to analyze their current traffic patterns and plan for future needs. To do so, they gather statistics and data regarding both personal and public transportation, which includes not only trollies, buses or subways, but also vehicles, bicycles and, in some cities, electric scooters.
The challenge with business intelligence is that it can be overwhelming in its volume and variety unless it is presented in ways that are easy to understand. That’s where data visualization plays an important role. Data is aggregated and calculated by measures (such as # of Objects, # of People, Avg Duration, or Maximum Objects/Hour), and then coordinated with dimensions (such as Time, Date, Class, Color, Source, Path & Area). Data visualizations can merge different data points to convey deeper insights and trends. The power of some data (such as number or types of vehicles using a certain roadway) is good, but the power of combining data points (such as vehicle types and types of accidents on variety of particular roadways) is exponentially valuable.
One common technology used to collect transit / traffic data is video content analytics (VCA), which leverages the video produced by video camera surveillance networks. Although video surveillance data is commonly only thought of as a public safety driver, it can also be harnessed as business intelligence about traffic patterns, and it can display aggregated data that has been collected over time. Powered by Deep Learning and Artificial Intelligence, video content analysis can distinguish objects in video footage, such as cars, trucks, buses, motorcycles, bicycles, women, men, children, and animals. For example, how many vehicles cross a certain intersection or a bridge in a certain span of time? Which intersections are the most dangerous for pedestrians? Video analysis helps urban planners identify traffic hotspots and optimize traffic flows, and data visualization is a key part of delivering that business intelligence.
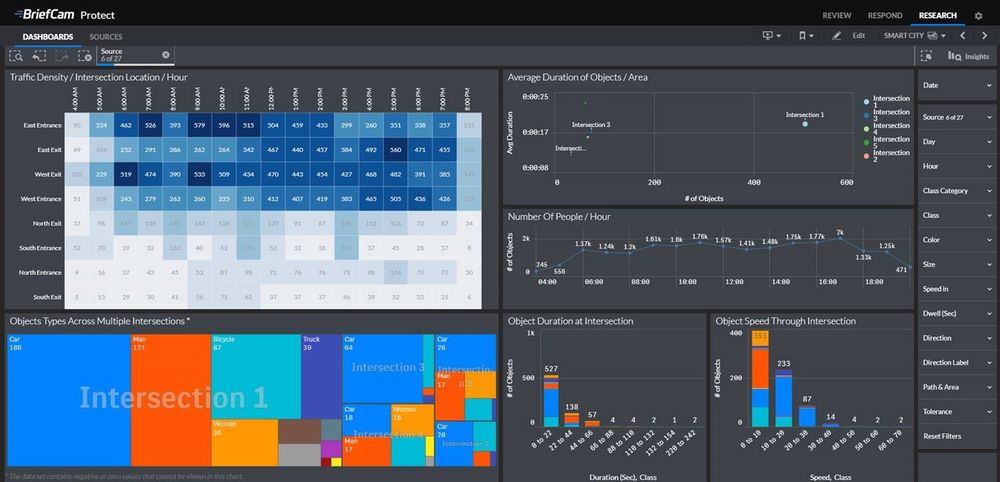
5 Forms of Data Visualization for Comparative Traffic Analysis
There are five common forms of data visualization that can be used for analyzing and comparing traffic over time, as explained below.
- Heat Maps heat maps are useful for evaluating traffic peaks across multiple cameras / intersections. For example, operators of video content analytics software can track traffic density in various areas, according to area and time. This can help urban planners detect intersections that are prone to congestion and/or collisions and take steps to mitigate / prevent future congestion or collisions. Heat maps typically use a variety of colors, rather than grayscale, to differentiate data groupings.
- Trend Graphs are useful ways to visualize long-term traffic trend analysis. Planners can see what patterns emerge, and which patterns tend to repeat. This allows them to discover anomalous behaviors, such as unexpected traffic peaks or atypical congestion.
- Tree maps are good for displaying hierarchical data; i.e., they can indicate which type of vehicle is most popular at a specific intersection, and what demographic of people visit a particular area. This data can also be displayed and easily consumed in a pie chart.
- Scatter Plots help users see the correlation between two measurements. For instance, it may correlate the number of people in a certain location, as well as the amount of time (duration) they spent in that particular location. City planners may note which streets people visit, and on which streets they spend more time, and compare durations at different locations.
- Histograms are a type of bar chart used to display the variation in continuous data like time, and number of vehicles, and number of vehicle accidents. A histogram enables a user to recognize and analyze patterns in data that are not apparent simply by looking at a table of data, or by finding the average or median. In terms of traffic analysis, histograms may be used in a variety of ways, i.e., city planners could evaluate multiple intersections and analyze the average vehicle speed for different types of vehicles. Or, a histogram could be used to analyze how much time people / vehicles spend at a particular location (How data is distributed over intervals).
Gathering Quantitative Insights
When individual graphs are displayed in dashboards alongside other business intelligence visualizations, the user can more effectively evaluate large sets to drive intelligent decision-making. By leveraging video content analytics and visualizing video data into dashboards, cities are empowered to monitor activity over the course of time, multiple cameras and various locations, and plan urban improvements and infrastructural changes based on actionable insights. Using data visualization to compare activity at a specific location across multiple days, cities can keep track of trends and anomalies and better prepare for expected and unexpected changes in traffic.
By aggregating data over time, planners gain quantitative insights about the efficiency of pedestrian paths or bike lanes, street or parking lot patterns, and where to add a new light or crosswalk. With data visualization, smart cities can unlock the data trends they have buried in their video surveillance data to optimize the safety and efficiency of their motorists, cyclists and pedestrians. When equipped with data that is highly relevant and easy to understand, urban planners, businesses, and municipal agencies can make better decisions about traffic management and improve public safety, public health and the overall quality of life for city residents, visitors and businesses.